Who can view the Usage Dashboard?
Only Organization Owners, or users explicitly granted Usage Dashboard permission, can access the Usage Dashboard.
Where can I view my credit grants?
The credit grants details table has been unified in the organization Billing page.
You can access them at https://platform.openai.com/settings/organization/billing/credit-grants.
Can I see Scale Tier data in the Usage Dashboard?
Yes. For organizations with Scale Tier enabled and the required access, the dedicated Scale Tier usage detail page is available at https://platform.openai.com/usage/scale-tier.
For Scale tier, note that costs of Scale tier bundles are attributed at the Org level, not project
Can I use the new Usage Dashboard to view Tokens Per Minute (TPM) data?
Yes. Usage data (non billing data) now provides interval selection. Inside the detail pages (), users will be able to select 1 minute data granularity to view TPM for any of the API capabilities.

What timezone does the usage dashboard use?
Data in the usage dashboard are displayed using UTC.
Why are there two project selection drop-downs?
To allow more flexibility for viewing a single, multiple or all project data, the usage page now has its own project selector that works independently of the current project selected in the top right bar. Use the dropdown from the screenshot
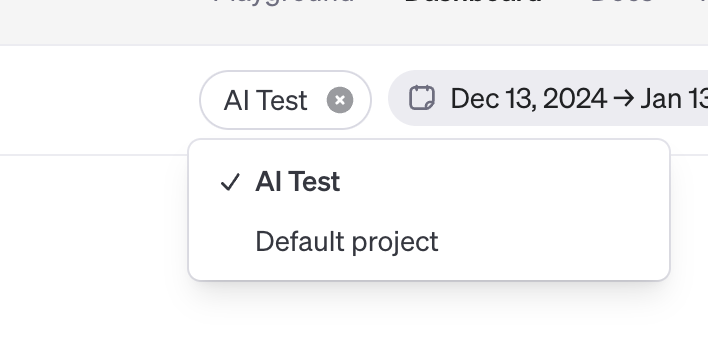
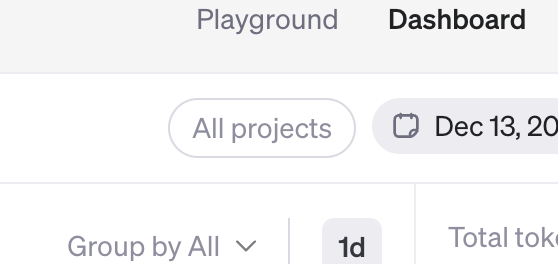
How do I see my overall organization data? (For organizations with projects)
To view overall organization data, use the project selector “x” to clear selection. If no projects are selected, it will default to showing all project data.
How can I see my consolidated organization data? (For organizations with sub-orgs)
The Usage Dashboard does not consolidate cost or usage data across organizations.
If you want to view combined cost data, consider migrating from sub-orgs to projects, or using the Usage API for custom analysis.
How can I view individual sub org data?
All organizations are treated as self contained entities. To view sub org data, you just need to select it in the org selection dropdown like any other organization.
How much data can I export?
There's no limit on the export time range, but if they request a long time range it may be broken into multiple files.
My usage for a certain model is >0, but spend for that model is $0
First check if you’re using Scale Tier. Most often, this is a confusion for how Scale Tier costs are attributed.
If all of your usage for a given model is within your Scale Tier TPM, then no costs will be incurred for that project. The Scale Tier subscription cost is always attributed to the Organization.
To see your Scale Tier subscription cost, make sure you don’t have a project filter set, and then select the Spend Categories tab.